Tuesday, 10 January 2012

Designing a website- part 2

During today’s lesson Remy, Abdul and I have disused who is doing what in the website.
Abdul:
Index, Software Download, Website Policy, About Us, Contact page
Ivaylo:
Index, Registration page, Products, Men’s Page, Check out
Remy:
Index, Accessories, Woman’s page, Accounts Page, Log In page
During the meeting we a little bit of a mix up since Remy and Abdul both decided to do a contact page, but no one was doing a Log in page which meant there was some reconsideration that needed to take place now Abdul does Contact page and Remy Log in page.

Thursday, 5 January 2012

Design a website - Site Maps

During the short lesson on Thursday the 5/1/12 I have completed a site map of the 5 pages I will be doing in the website task and also a draft of a site map where I combined all the pages in the group on to the site map.  In my opinion the site map is fairly strong and it would be a strong candidate for it to be used so the website follows the principle.

Thursday, 10 November 2011

Task 5

Task 5

1)      Draw a simple Water fall diagram.

2)
  [i]
1.    Requirements + Analyst| This step is where all the things that are need to be done in the project are listed and discussed with the customer. This step is a key step because if it’s missed then the company wouldn’t know what is needed to create the project.
2.    System Design| This stage is where all the templates are going to be produced in order to get a raff idea of what the project will look like, sketches of what the project will look like and presentations of how it's going to perform. This stage is very important because if it is not done up to the requirements then the project might fail. This also involves the defying the architecture components, modules, interfaces and the data which the requirements require. 
3.    Coding/Writing| The actual creation of the web design is being done. This step is where all the preparation of the whole project is finally put together.
4.    Test| This stage is where the system is getting tested during the actual build and whether the program/website works correctly. Or known as Alpha testing.
5.    System Testing| this is where the BETA version of the program is given to the customers so they can dry run them self in order to see if the program would be able to handle the commands.
6.    Implantation| this is the final stage where the program would be actually put on live.
7.    Going back again| the system will be going back from the beginning the reason behind this is that the customer’s demands change all the time and gets out of data therefore the system gets redesigned.

3)      Benefits and Limitations

Benefits:
Although this type of system is being used now for creating a new project the same systems with the same steps can be use in order o keep the system up-to-date, this is important so a new would not need to be produced for the maintenance for years to come. The system is very basic so any one can understand the implantation of it so the customer for example knows roughly what stage the program is for it to be created this way they can predict things such as when it’s going to be finished. Although the first version of the program might be unsuitable the diagram can take the project and figure out an answer to the problem. 

Limitations:
This is designed so you can can’t go a step backward but do all the steps before going to the step need in order to get to the step you wanted to go back to in the first place. But because you don’t go back when redoing the step newer and better upgrade can be arranged in order for the better.  Some of the time the customer may not be 100% sure what they want from the software and by that changing the way the program operates half way during the build by that the whole process would have to be repeated which may course annoyance between the contactor and customer. [ii]


[i] David’s presentation from RUTC Moodle on Unit 4: IT Project Assignment 1 – Project Life Cycle 3/10/2011

Wednesday, 12 October 2011

Project Life Cycle 3

Task 3:  

Different types of methodology that can support the project manager include:

Brainstorming:

The Brainstorming method was created in the 50’s by a Alex Faickney Osbornn where the members of a company would gather together and list their ideas in order to overcome potential/current problems that the company may be facing. This method has proven to be very effective by that it has been used from big business to small children in primary schools to gather their ideas together.[i] An easy and time effective way to add to think of ideas.
Benefits: Brainstorming usually takes place when a question is written in the middle of the page and circled so it’s distinguishes it’s self from the answers that the team or individual is trying to come up with. This is good way so number of employees working in the business environment can put their ideas down. Because in a team there are lots of people working on different things the team manager can always stay on top of each member’s contribution and problem.  By that each member of the team can contribute further without over shadowing or blocking each member’s idea.
 [ii]
Draw backs? Because the ideas are just put on the paper the company still may experience problem when to apply the solution. Brainstorms don’t give answers when for the manager act in order to eliminate problem but just puts each member’s contribution on paper so the manager can decide what to do. 

Gantt charts:

Gantt charts where first created in the 1900’s by Henry Gantt in order to have a scheme or a target in order so Colonel can keep track of their progress in the First World War. The chart did become fully acknowledge by the general public until they where firstly introduced in the 1990’s in order so managers can keep up a scheme which helps them keep track of time. [iii]
Benefits: Gantt charts are a brilliant way to keep track of time and now since most things are computerised the process in doing so is even better Microsoft Office/excel offer such discretion in order so team leader always know what and when should be completed. These strict time lines are a great so everyone in a team knows exactly when their time for a certain assignment has got to do, so this way if anything comes in because of a technical fail the chart can adjust itself in order to  still meet the dead line. This type of facility can be found on electronic computer and on not highly qualified professionals can use Microsoft Office Excel in order to create such a simple chart.
Disadvantages: Sometimes when working in a big team as 30 members would contribute it can be difficult for all the members to be tracked using this method, this method would work better as a individual writes he’s tasks.

PERT charts:

Pert charts are used to illustrate the company’s plans and their intentions of what their steps are going to be in order to solve a problem or a task set.  PERT charts where first developed by the American Navy during the 1950’s. PERT chars (Project Evaluation and Review Technique)[iv]
Benefits: Pert charts show the entire range step to be taken all-in-all to get every thing ready by the final dead line especially in the business environment where a high level of professional contest is being used.
Drawbacks: Although can sometime be complicated to be tracked down on what step each member is on and when they will be complicating each task they can be very difficult to produce on paper so a computer would have to be used so new tasks can be added. [v]

Critical Path Analysis:

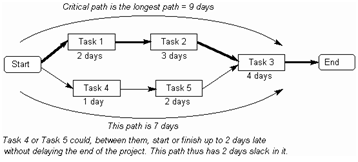
The very first critical path analysis diagrams where drawn during the 50’s Morgan R. Walker of DuPont and James E. Kelley the most important thing to know about this diagrams is that they always have  begging and an end to when they finish, they also include a time period of how long each task will take. In the business environment this is very important for the team manager so they can keep track of time and whether they have completed the task or not which is the most important perspective of the chart.[vi]
Benefits: this type of chart is great to use since it clearly states how long each task should take but because the chart works with estimations the time of when a task is started and ended can give flexibility to the project manager, in case of a technical failure approaches the team members. Expansion of the task can also be adjusted to the task all in order to up bring the teams end result of the task set. For example, to add an extra picture on the makings of a new webpage.
Drawbacks: Although this chart gives out a great number of detail to the project manager it’s takes a long time to produce meaning not all project leaders will be prospered to take their time to draw something in their time when they can be getting with something worth the while such as the task set.


Project Tools Task 2

Task 2:

1)
Methodology is usually known as the term to solve a problem in this case when designing the website the project manager can run into different problems such as delay issues, website problems or staff issues, the project manager can decide how to overcome the problem by using methodology[i].  The reason why a company would need a mythology system is so it can keep on top of their programming. This way when a problem occurs, the problem can be figured out easy and efficiently.
Benefits: By using a methodology method to keep track of a project the project can be done in stages, this is will help the project manager so they are always on top of their task. Other types of methodology  can actually support and give a predictive time period when the program will be completed. The company avoid spending extra time to think of a solution how they can tackle the project, mythology give the out lines in doing so. Because each member can be attached to a task when they finish it they can be assigned to a new one in a different project giving flexibility for their usage in the environment and capability in producing what is needed.
Limitations: Using some methods may limit the design in the basics that you can’t go back to a previews task.  This would mean to redo the first task over again. Resolving in lots of confusion with in team members.  Most small projects can be over complicated by using such methods in doing a project.
2)
Prince 2 was firstly introduced in 1996 after few earlier less successful effort in 1989, Prince 2 became more and more popular therefore it became the standard generic method for project managing.  The Prince 2 is based around 7 steps they are:
·         Starting up a project
·         Initiating a project
·         Directing a project
·         Controlling a stage
·         Managing stage boundaries
·         Managing product delivery
·         Closing a project[ii]
Please refer to the water fall description below.
3)
The water fall method is another type methodology which is based on the same principle where each task is done separately and wrote so it’s done in different stages.
The water fall method is much more task orientated by that that each task should be finished before they can move on to different task where as  Prince 2 the project manager can go back to task where they can finish bits of or add extras which customers may be requirement.
Price and the waterfall mythology share the same principle of a cycle this way the system this means a new system would not be produced every new assignment or task, by that the project time will be shorten for the next one and money wouldn’t get spend on developing them.

Introduction

 Task 1:

Introduction:
In this course work I will be talking about the different types of methodology that can be used in order to improve the business and the company. I will be also talking about which are the most effective methods and why they are the better other in the industry and the business environment.   Methodology  is typically known as set coordinated activities to solve a problem of activity.
In Task 2, I will be also showing the benefits and the limitations of two methodology, Prince 2 and Waterfall method by that also comparing them with each other.
In Task 3, I will be describing the benefit of the methodology  methods tools and their benefit to a project team:
        I.            Brain storming
      II.            Gantt Charts
    III.            PERT Charts
    IV.            Critical Path Analyst
In Task 4: I will be describing how Microsoft Project can be used as a project managing software, and talking about how Smartsheet a purely online based software can also be used as a project managing.
In Task 5: I will be drawing a waterfall diagram and by that also labelling it and describing what each stage does on it.
In Task 6: I will be referencing all my work to a number of links where I found some information out about 

Task 6


Task 6


Reference:

[1] Wikipedia http://en.wikipedia.org/wiki/PRINCE2 05/10/11


[1] David’s presentation from RUTC Moodle on Unit 4: IT Project Assignment 1 – Project Life Cycle 3/10/2011
[1]Buzzel http://www.buzzle.com/articles/waterfall-model-advantages-and-disadvantages.html 05/10/11