Task 3:
Different types of methodology that can support the project manager include:
Brainstorming:
The Brainstorming method was created in the 50’s by a Alex Faickney Osbornn where the members of a company would gather together and list their ideas in order to overcome potential/current problems that the company may be facing. This method has proven to be very effective by that it has been used from big business to small children in primary schools to gather their ideas together.[i] An easy and time effective way to add to think of ideas.
Benefits: Brainstorming usually takes place when a question is written in the middle of the page and circled so it’s distinguishes it’s self from the answers that the team or individual is trying to come up with. This is good way so number of employees working in the business environment can put their ideas down. Because in a team there are lots of people working on different things the team manager can always stay on top of each member’s contribution and problem. By that each member of the team can contribute further without over shadowing or blocking each member’s idea.
Draw backs? Because the ideas are just put on the paper the company still may experience problem when to apply the solution. Brainstorms don’t give answers when for the manager act in order to eliminate problem but just puts each member’s contribution on paper so the manager can decide what to do.

Gantt charts:
Gantt charts where first created in the 1900’s by Henry Gantt in order to have a scheme or a target in order so Colonel can keep track of their progress in the First World War. The chart did become fully acknowledge by the general public until they where firstly introduced in the 1990’s in order so managers can keep up a scheme which helps them keep track of time. [iii]
Disadvantages: Sometimes when working in a big team as 30 members would contribute it can be difficult for all the members to be tracked using this method, this method would work better as a individual writes he’s tasks.

PERT charts:
Benefits: Pert charts show the entire range step to be taken all-in-all to get every thing ready by the final dead line especially in the business environment where a high level of professional contest is being used.
Drawbacks: Although can sometime be complicated to be tracked down on what step each member is on and when they will be complicating each task they can be very difficult to produce on paper so a computer would have to be used so new tasks can be added. [v]


Critical Path Analysis:
The very first critical path analysis diagrams where drawn during the 50’s Morgan R. Walker of DuPont and James E. Kelley the most important thing to know about this diagrams is that they always have begging and an end to when they finish, they also include a time period of how long each task will take. In the business environment this is very important for the team manager so they can keep track of time and whether they have completed the task or not which is the most important perspective of the chart.[vi]
Benefits: this type of chart is great to use since it clearly states how long each task should take but because the chart works with estimations the time of when a task is started and ended can give flexibility to the project manager, in case of a technical failure approaches the team members. Expansion of the task can also be adjusted to the task all in order to up bring the teams end result of the task set. For example, to add an extra picture on the makings of a new webpage.
Drawbacks: Although this chart gives out a great number of detail to the project manager it’s takes a long time to produce meaning not all project leaders will be prospered to take their time to draw something in their time when they can be getting with something worth the while such as the task set. 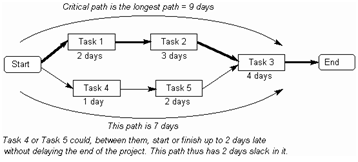
[ii] Google Images (search) http://www.google.co.uk/imgres?q=brainstorming+diagram&um=1&hl=en&sa=X&biw=1214&bih=600&tbm=isch&tbnid=QT56yaKfWGPACM:&imgrefurl=http://www.sageperformance.com/drjeffallen/literature.htm&docid=zQqefReaFktTpM&w=629&h=400&ei=QCuLTq_sJKmM0AXrid3tBQ&zoom=1&iact=hc&vpx=707&vpy=150&dur=3133&hovh=179&hovw=282&tx=157&ty=113&page=1&tbnh=109&tbnw=171&start=0&ndsp=18&ved=1t:429,r:4,s:0 05/10/11
[v] Google Images (search) http://www.google.co.uk/imgres?q=pert+chart&um=1&hl=en&lr=&safe=active&sa=N&tbm=isch&tbnid=APGfYlRcSkiAhM:&imgrefurl=http://molinaedgar.blogspot.com/2011/02/pertgantt-chart.html&docid=Uez_ZHfh2nMCGM&w=853&h=533&ei=PRaMTtaqA6Lb0QWUnojVBQ&zoom=1&biw=1280&bih=881&iact=rc&dur=233&page=1&tbnh=152&tbnw=243&start=0&ndsp=17&ved=1t:429,r:8,s:0&tx=175&ty=86 05/10/11